It has been a year unlike any other. But no less busy.
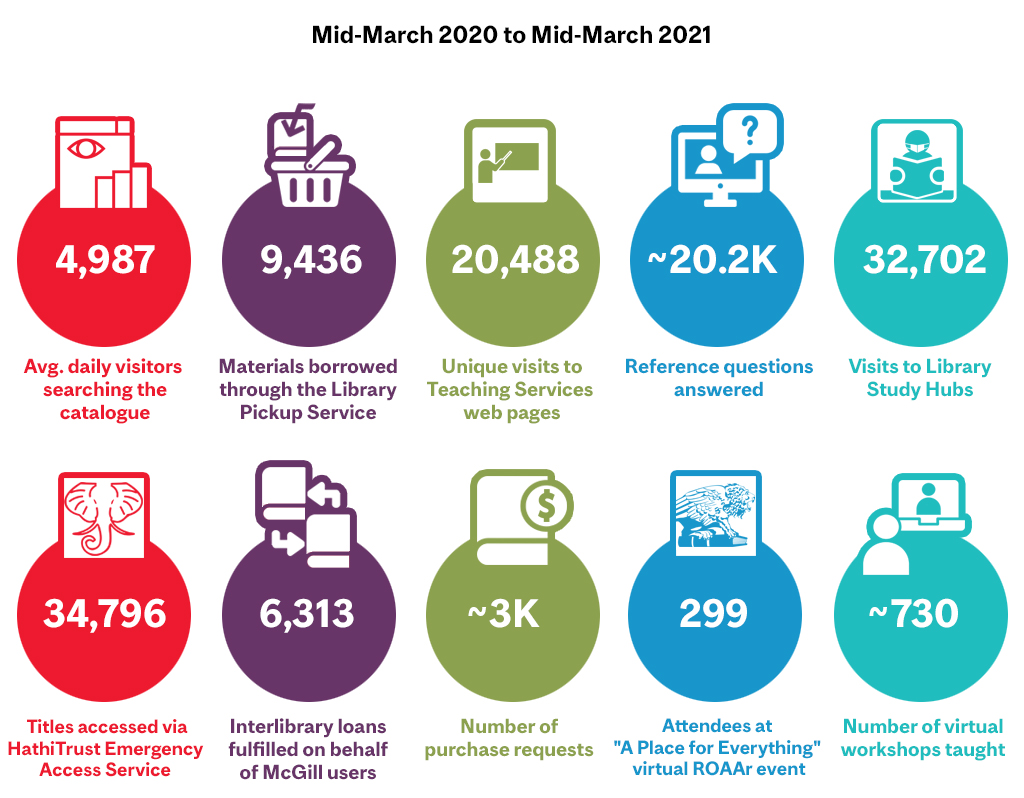
Library stats from March 2020 to March 2021 show how we pivoted. We did our best to reach out through the computer screen and connect McGillians with Library materials, workshops, study spaces, and more, despite the obstacles.
Thank you to the entire McGill community for your patience, resilience, encouragement, and kindness throughout this most unusual year.

- Average daily visitors searching the catalogue: 4,987
- Materials borrowed through the Library Pickup Service: 9,436
- Unique visits to Teaching Services web pages: 20,488
- Reference questions answered: approximately 20.2K
- Visits to Library Study Hubs: 32,702
- Titles accessed via HathiTrust Emergency Access Service: 34,796
- Interlibrary loans fulfilled on behalf of McGill users: 6,313
- Number of purchase requests: approximately 3K
- Attendees at “A Place for Everything” virtual ROAAr event: 299
- Number of virtual workshops taught: approximately 730
Special thanks to Greg Houston and Giovanna Badia for pulling together the numbers and infographic.


Leave a Reply
You must be logged in to post a comment.